
April 23, 2025: Equity Market Volatility…A Good Problem?
Considering the recent equity market volatility witnessed this year (and especially this month), we are reminded of a common refrain often heard in times such as these, along the lines of: “I know this has happened before, but this time just feels different.” But is it really…and if so, how? One method employed to gauge equity market volatility is performed “bottom-up,” or more specifically, by measuring the number of individual equities that have experienced above-average price movements within an index. As an example, many would likely be surprised to learn that – in the 30-year period dating from 1995 to 2024 – the average number of securities within the S&P 500 Index that have experienced a drawdown of 5% or more at any point during the calendar year is 372 – or nearly 75% of the entire index. Furthermore, the average level of 372 was exceeded in 18 of the 30 years, with the most recent occurrence witnessed in 2022. With the data set concluding in calendar year 2024, we wondered: how many companies in the S&P 500 have experienced more than 5% drawdown thus far in 2025 as of last Thursday’s close? The answer: all but two.
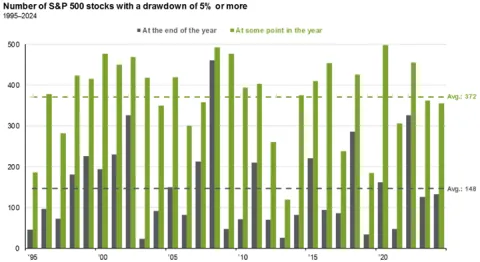
SOURCE: J.P. Morgan Asset Management
While this might sound ominous, a strong case could be made that this may actually fall in the “good problem” bucket: in the 18 years where an above-average number of S&P 500 firms experienced a drawdown of 5% or more, the S&P 500 Index total return for the following year exceeded the average annualized total return in 12 of the 18 instances, with a median return of +15.9%, or a full five percentage points above the annualized rate of +10.9%. Moreover, three of the six years in which the next-year index return did not exceed the annualized return rate occurred from 2000-2002, which saw the bursting of the dot-com bubble, the unspeakable events of 9/11, and the subsequent U-shaped recession. We also highlight that the forward year total returns for the most recent three occasions (2008, 2009, and 2020) when over 95% (475+) of the S&P 500 firms experienced a 5%+ drawdown, registers a robust +23.4%. A recent research note by BofA Merrill Lynch further supports these findings and notes that – since 1990 – when the VIX closes the trading week above the 45 level, the average return of the S&P 500 has registered +50.6%, +112.7% and +220.9% over the ensuing three-, five-, and ten-year ensuing periods, respectively. Bottom line: while history doesn’t repeat itself, it often rhymes...and if history is any guide, we very well might look back to the volatile days of Spring 2025 and view it in hindsight as a blessing rather than a nuisance.
By the Numbers:
- 372: 30-year avg. of SPX firms with a 5%+ drawdown in a year
- 18: years the # of SPX firms have exceeded the average of 372
- 12 of 18: number of occurrences the forward year total return exceeded the 30-year annualized return
- +15.9%: median total return in all 18 occurrences
- +112.7%: 5-year forward price return following weekly VIX close greater than 45 (Jan 1990 – April 2025)